6 Data Analysis
For this week, we will learn about how to evaluate and analyze data while considering security, privacy, ethics, and equity.
6.1 Quick recap on week 3 (with some week 2)
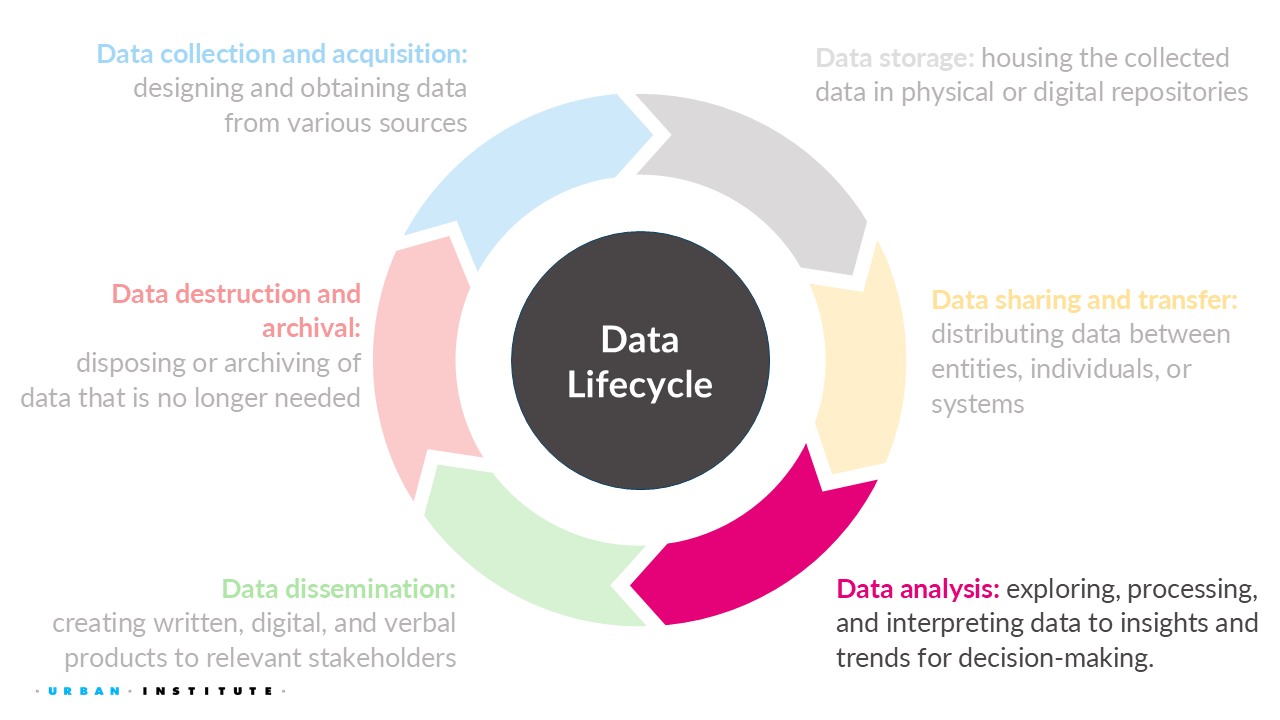
We’ve discussed several challenges surrounding security, privacy, ethics, and equity in data collection, storage, and sharing.
6.1.1 Data collection
For data collection, we learned the importance of:
- Deciding whether to collect the data or not.
- Defining groups and other variables that impacts our communities.
- Recognizing that a lack of data results in a lack of action.
6.1.2 Data storage
We covered the following topics:
- The overall process and considerations for cleaning data, especially how to handle missing data.
- Best practices for virtual and physical storage of data, including the FAIR principles for creating proper metadata.
Even more definitions…
Original dataset is the uncleaned, unprotected version of the data.
For example, raw 2020 Decennial Census microdata, which are never publicly released.
Confidential or gold standard dataset is the cleaned version (meaning edited for inaccuracies or inconsistencies) of the data; often referred to as the gold standard or actual data for analysis.
For example, the Census Edited File that is the final confidential data for the 2020 Census. This dataset is never publicly released but may be made available to others who are sworn to protect confidentiality (i.e., Special Sworn Status) and who are provided access in a secure environment, such as a Federal Statistical Research Data Center.
Public dataset is the publicly released version of the confidential data.
For example, the US Census Bureau’s public tables and datasets or the Bureau of Labor Statistics reporting the unemployment rate statistics.
6.1.3 Data sharing and transfer
We also learned about the two general ways people access data:
- Secure Data Access
- Pros: Very secure, provides access to confidential data.
- Cons: Inaccessible to most people.
- Public Data Files and Statistics
- Pros: Accessible to anyone.
- Cons: Altered for privacy, which may reduce accuracy for specific applications and may not always be properly protected.
6.1.4 Week 4 Assignment
Read
- Chapter 5: What Makes Datasets Difficult for Data Privacy?
Watch (Optional)
Write (600 to 1200 words)
Find a news analysis story1 published within the last year (2024 – 2025) and answer the following questions:
- What does the article claim?
- Does the content of the article apply to you, your family, and/or your community?
- What makes you believe the conclusions?
- Who wrote the article?
- Where did the article get their facts?
- What “red flags” (if any) do you notice?
- Would the story change if there was more or less access to data? What would be that story?
6.2 PETs Process Overview
Note that this overview is opinionated and simplified in order to provide a reasonable summary.
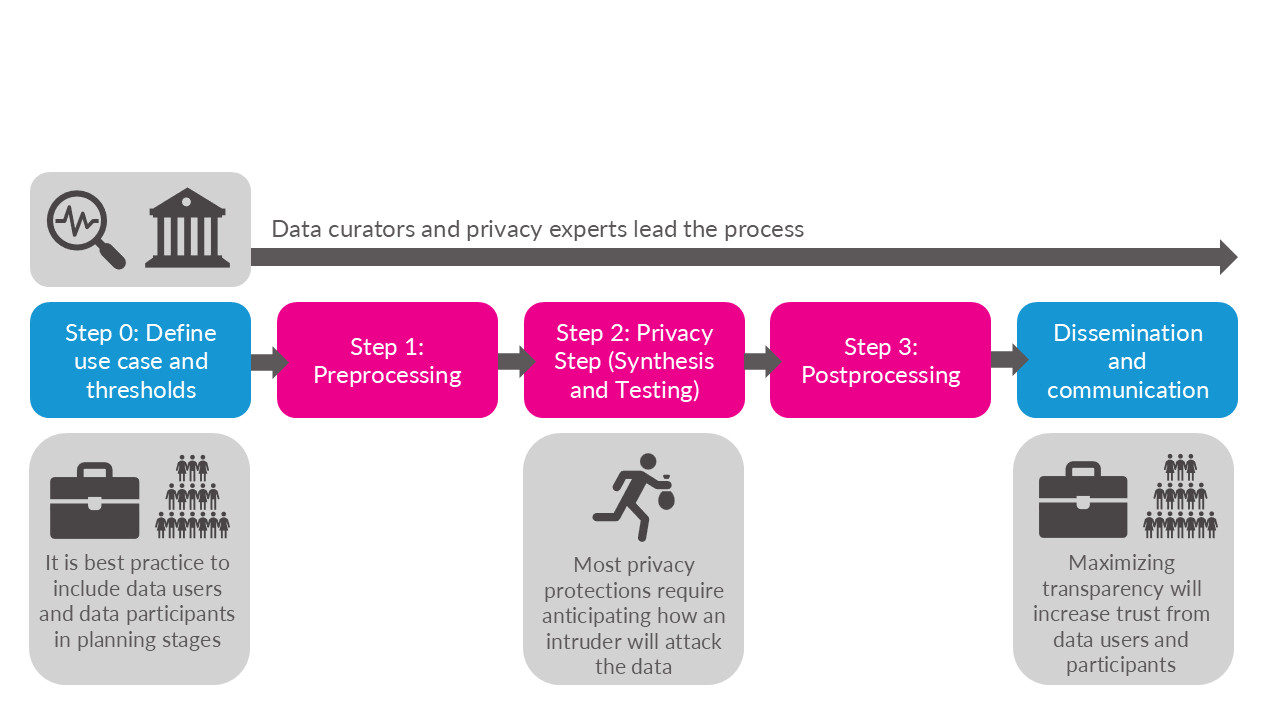
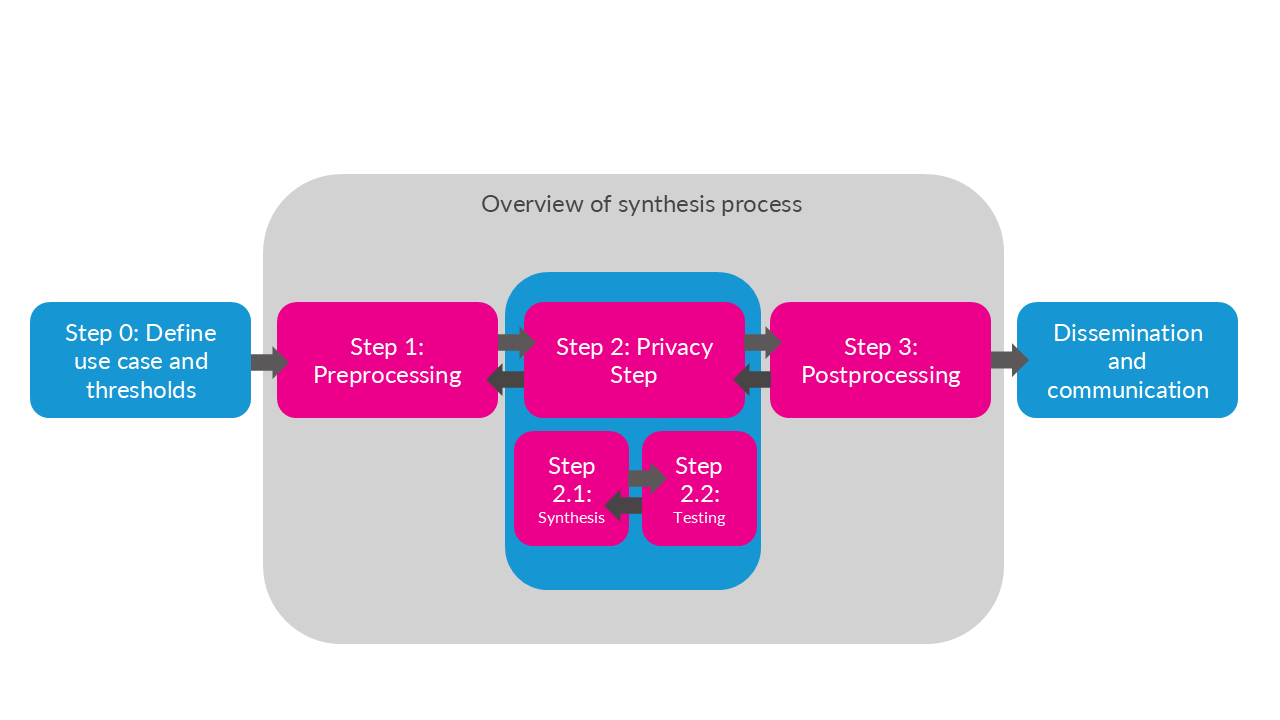
6.2.1 Iteration is key
As mentioned in the textbook, data curators and privacy experts must fine-tune their PETs methods by repeatedly evaluating if the altered data are at acceptable levels of disclosure risk and quality. Often, the process of adjusting the PETs methods and earlier steps in the process becomes analogous to “holding sand.” Shifting or changing one part of the workflow, such as trying to improve the data quality for one variable, can result in the privacy “spilling out” in unexpected ways. Or a model you thought would create high quality data could result in the opposite.

6.3 What is the privacy-utility tradeoff?

6.4 Privacy-Utility Tradeoff
One of the most important challenges in statistical disclosure protection is managing the fundamental tradeoff between privacy loss and statistical utility. As we will see throughout this class, this tradeoff plays a central role in determining the technical approaches to data protection and in shaping ethical and equitable decisionmaking.
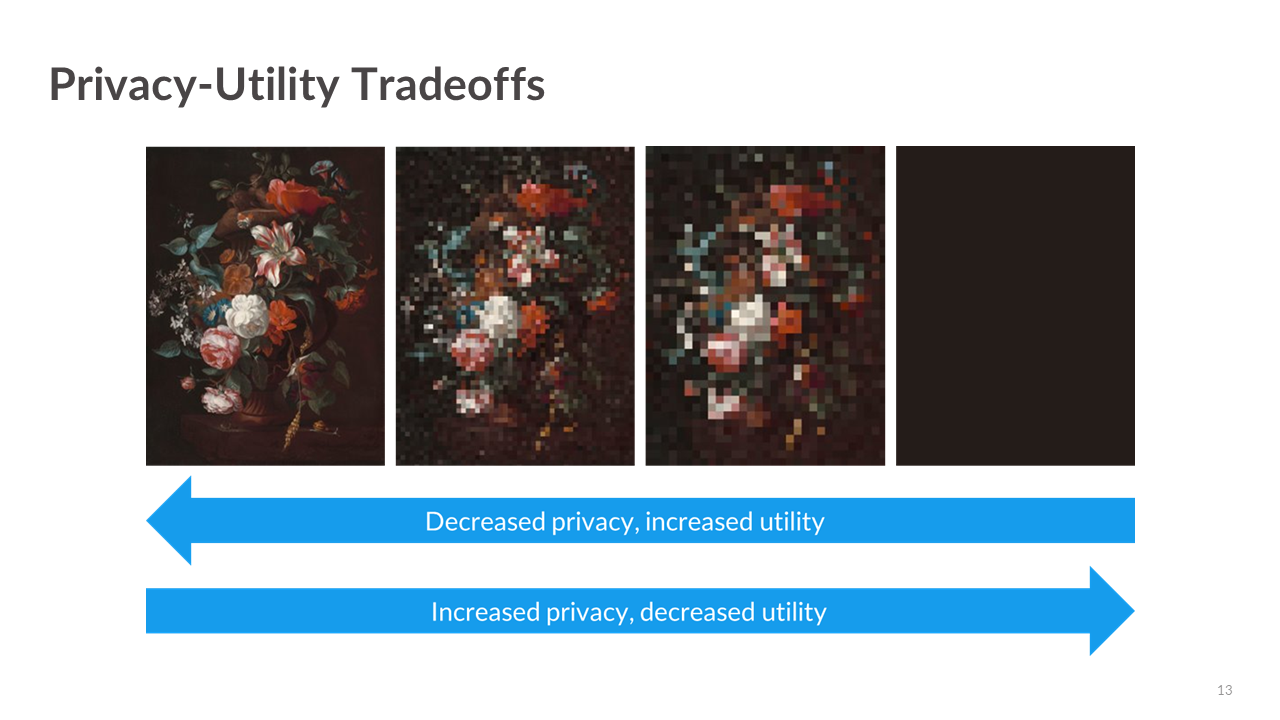
The privacy-utility tradeoff describes the relationship between the amount of privacy protection applied to a dataset and the utility (or usefulness) of that data for analysis.
Privacy loss is often referred to as the risk that confidential or sensitive information about individuals, records, or entities being directly observed or inferred from the release of public data and statistics.
Utility can be defined as the quality, qunatity, ease of access, permitted use and dissemination, and more (e.g., research, policy analysis, public reporting).
Example from Bowen and Snoke (2023): Suppose someone decided to release unaltered confidential data, say an individual’s official tax records. This scenario would result in the maximum privacy loss to the individual but simultaneously the maximum value to society that could be obtained from the data. Details about the person’s income, investments, donations, and Social Security number would be available to the public, but researchers could use that information to better understand issues such as income inequality and financial investment decisions. Conversely, if no data were released, the resulting analysis (or lack thereof) would simultaneously constitute the minimal privacy loss and the minimal value to society that could be derived from this dataset.
6.5 Assessing utility
Generally there are three ways to measure utility of the data:
- General (or global) utility metrics;
- Specific utility metrics; and
- Fit-for-purpose
6.5.1 General utility metrics
General utility, sometimes called global utility, measures the univariate and multivariate distributional similarity between the confidential data and the public data (e.g., sample means, sample variances, and the variance-covariance matrix).
General utility metrics are useful because they provide a sense of how “fit for use” public data is for analysis without making assumptions about the uses of the public data.
Univariate general utility
Some univariate general utility measures could include comparisons of:
Categorical variables: frequencies, relative frequencies.
Numeric variables means, standard deviations, skewness, kurtosis (i.e., first four moments), percentiles, and number of zero/non-zero values.
Bivariate general utility
Correlation fit measures how well the synthesizer recreates the linear relationships between variables in the confidential dataset.
To calculate correlation fit:
- Create correlation matrices for the public data and confidential data. Then measure differences across public and confidential data.
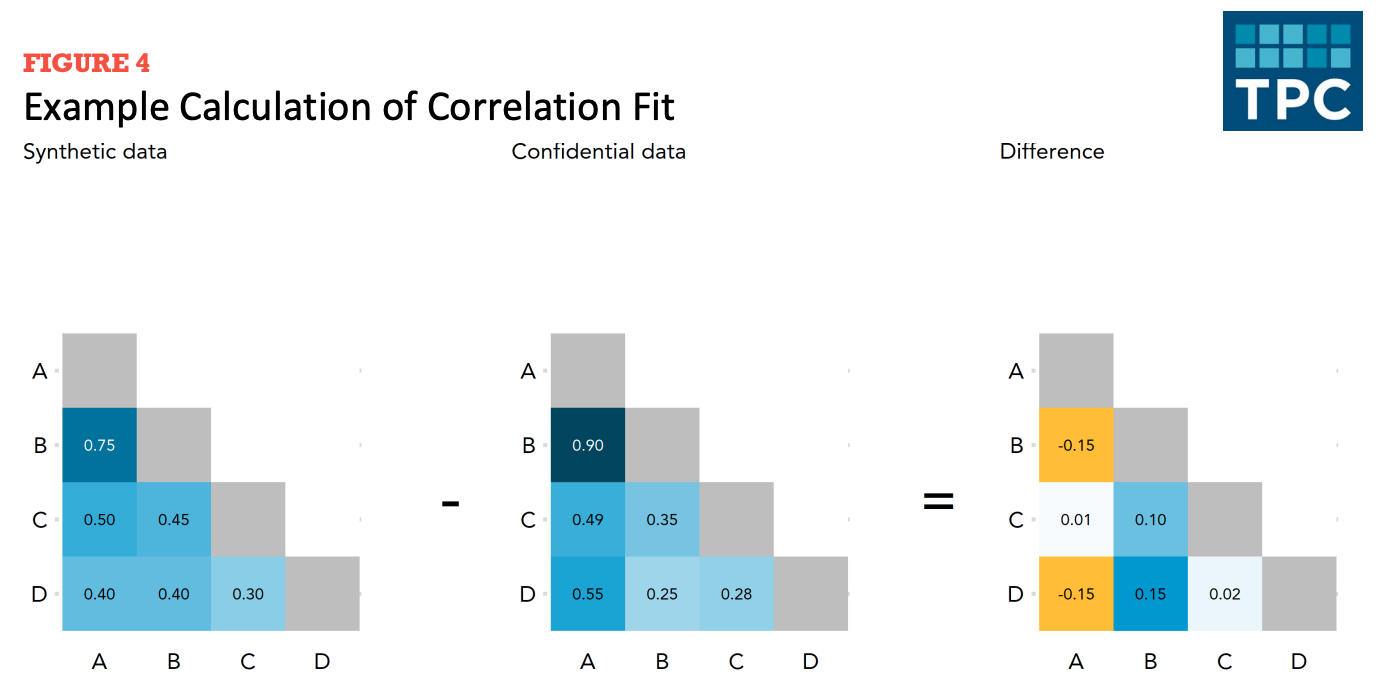
Figure 6.8 shows the creation of a difference matrix. Let’s summarize the difference matrix using mean absolute error.
Multivariate general utility (discriminant-based metrics)
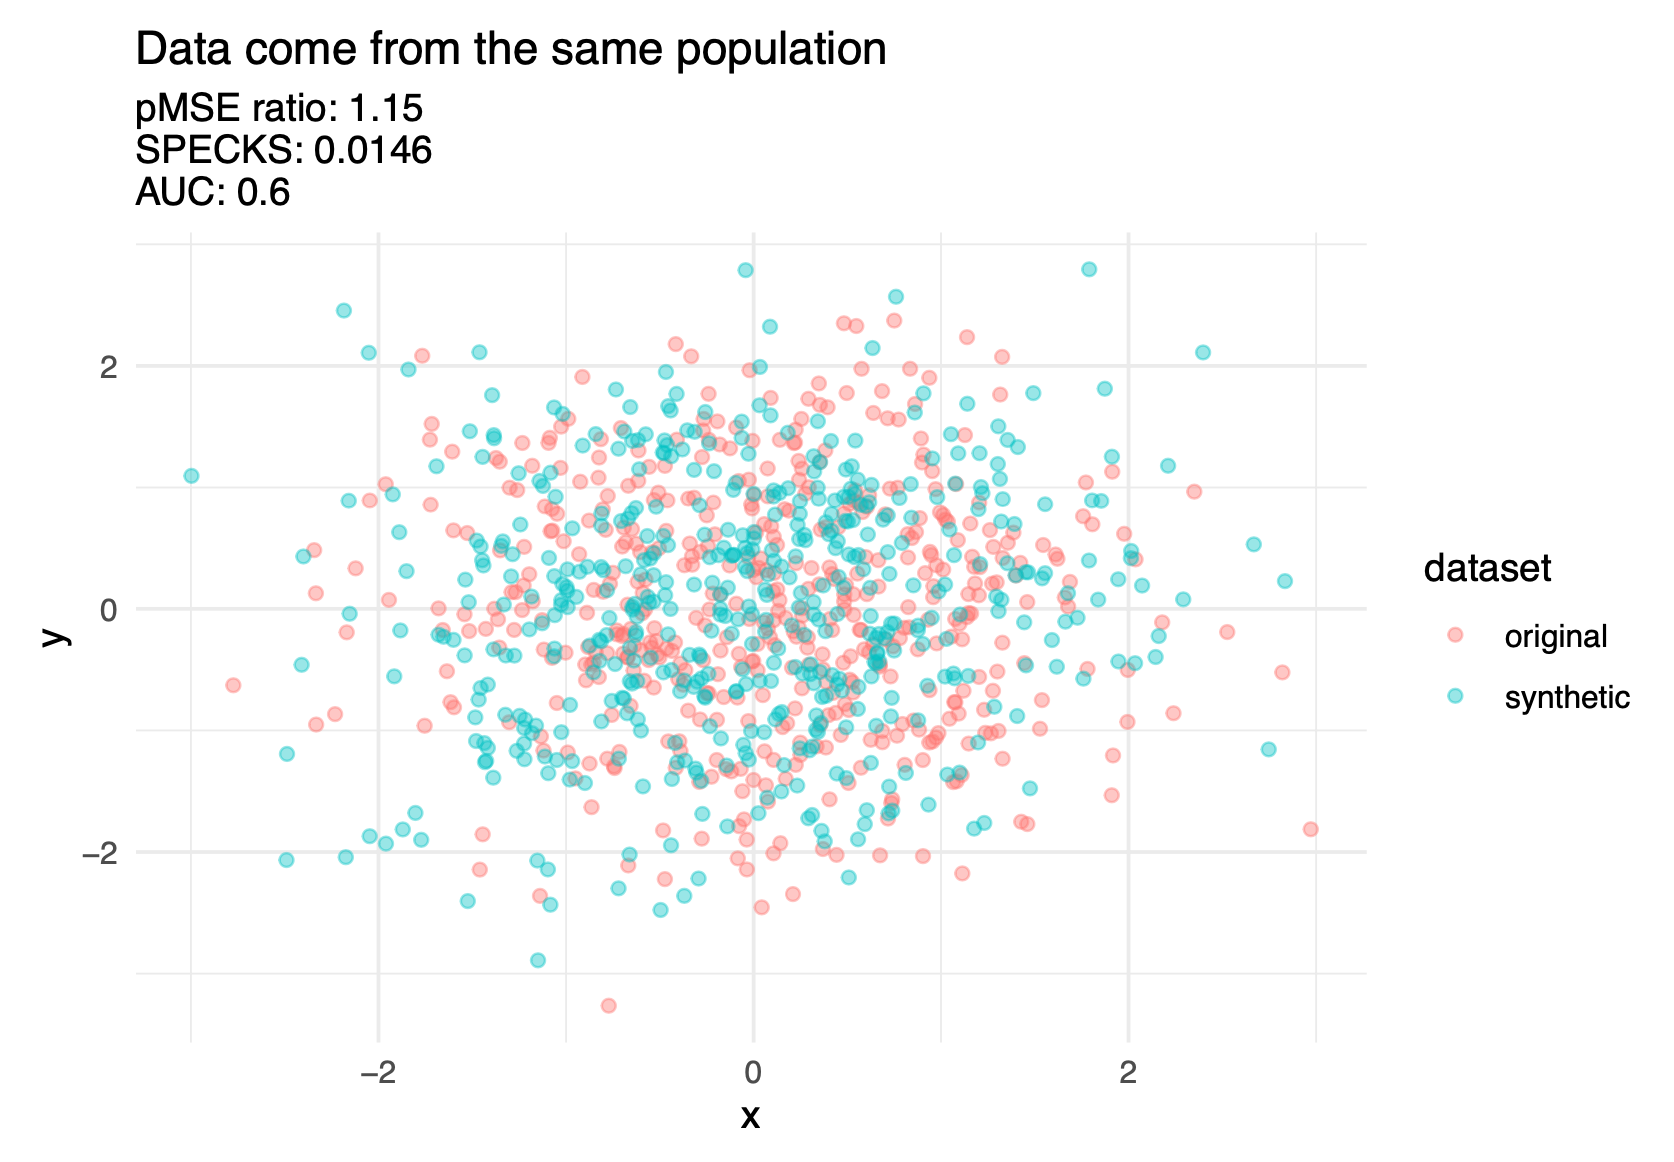
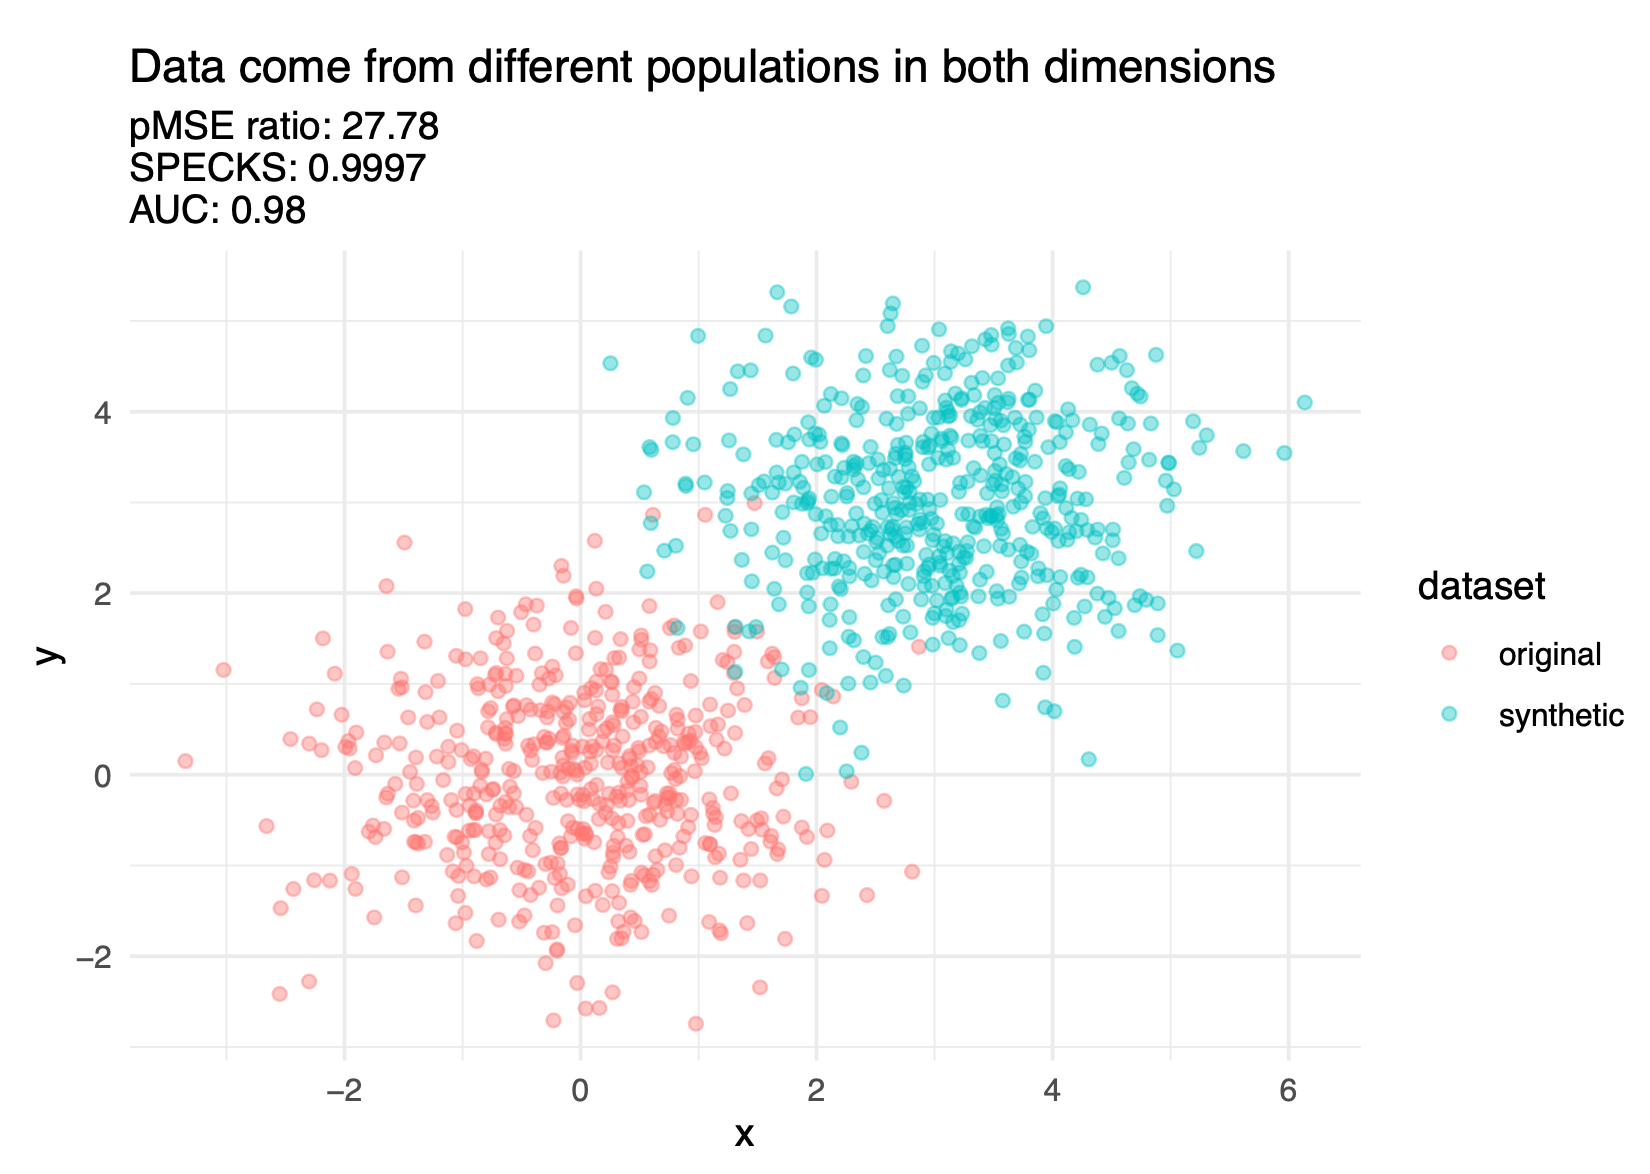
Discriminant based methods measure how well a predictive model can distinguish (i.e., discriminate) between records from the confidential and public data (most commonly applied to synthetic data).
The confidential data and public data should theoretically be drawn from the same super population.
The basic idea is to combine (stack) the confidential data and public data and see how well a predictive model distinguish (i.e., discriminate) between public observations and confidential observations.
An inability to distinguish between the records suggests a good synthesis.
It is possible to use logistic regression for the predictive modeling, but decision trees, random forests, and boosted trees are more common. (We recommend, to the degree possible, using more using more sophisticated models as well as machine learning best-practices like feature engineering and hyperparameter tuning because these practices will more effectively discriminate between classes.)
Figure 6.9 shows three discriminant based metrics calculated on a good synthesis and a poor synthesis.
There are several different discriminant-based metrics, but it is beyond this course to cover them in depth. Hu and Bowen (2024) covers these metrics in further detail.
6.5.2 Specific utility metrics
Specific utility, sometimes called outcome specific utility, measures the similarity of results for a specific analysis (or analyses) of the confidential and public data (e.g., comparing the coefficients in regression models).
Specific utility metrics measure how suitable a public dataset is for specific analyses.
- These specific utility metrics will change from application to application, depending on common uses of the data.
- A helpful rule of thumb: general utility metrics are useful for the data synthesizers to be convinced that they’re doing a good job. Specific utility metrics are useful to convince downstream data users that the data synthesizers are doing a good job.
Recreating inferences
- It can be useful to compare statistical analyses on the confidential data and public data:
- Do the estimates have the same sign?
- Do the estimates have the same statistical inference at a common significance level?
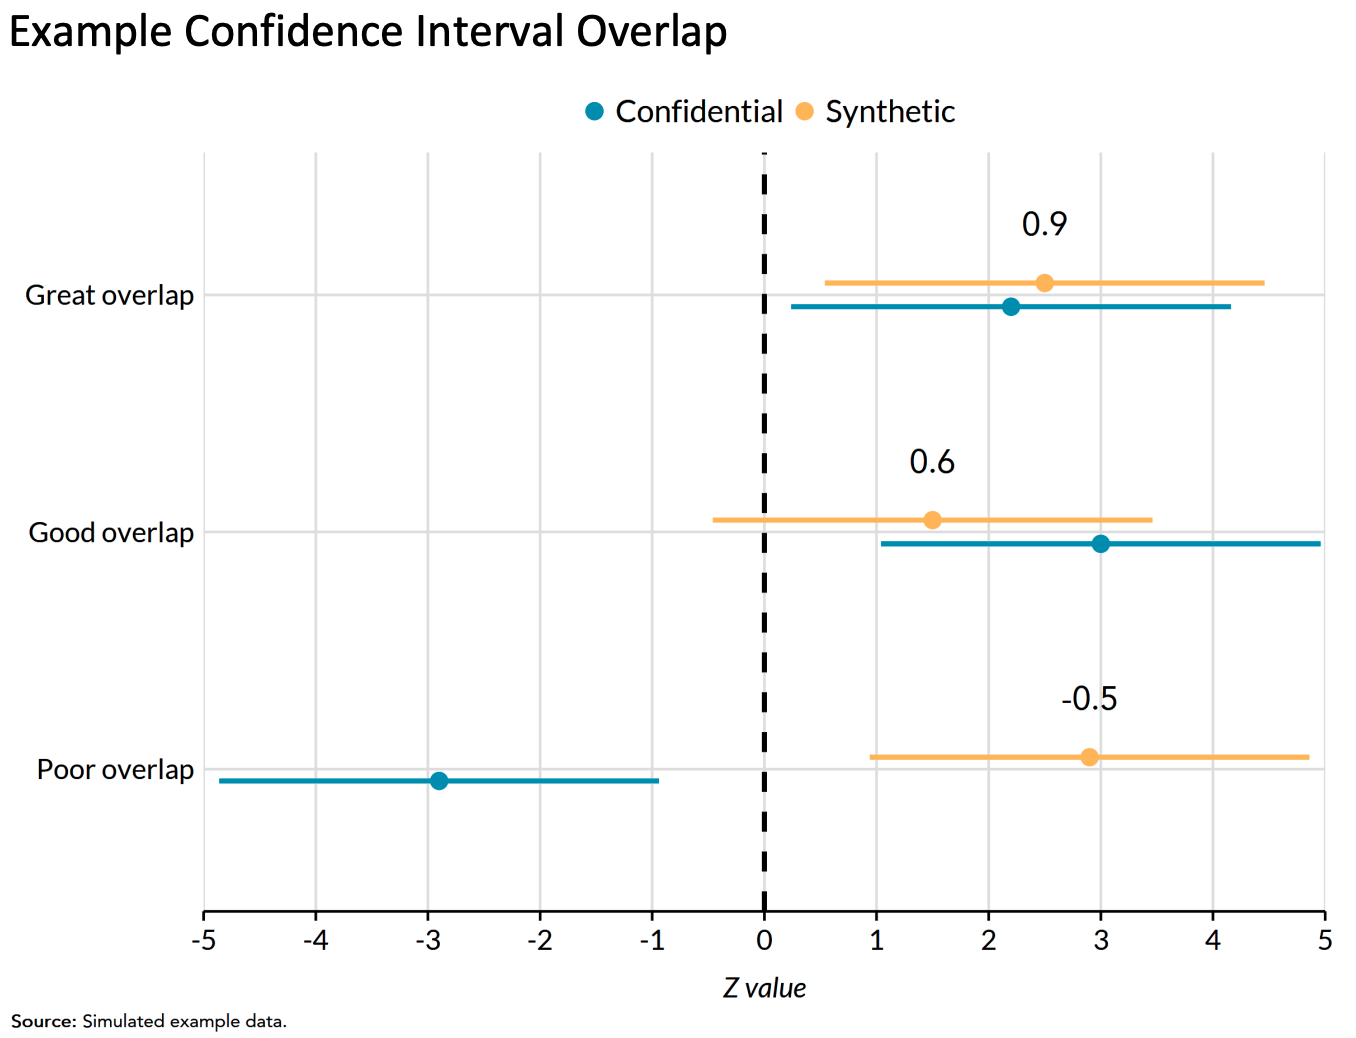
- Do the confidence intervals for the estimates overlap?
- Each of these questions is useful. Barrientos et al. (2024) combine all three questions into sign, significance, and overlap (SSO) match. SSO is the proportion of times that intervals overlap and have the same sign and significance.
Regression confidence interval overlap
Regression confidence interval overlap quantifies how well confidence intervals from estimates on the public data recreate confidence intervals from the confidential data.
1 indicates perfect overlap (it is typically impossible to achieve a 1 on real-world data). 0 indicates intervals that are adjacent but not overlapping. Negative values indicate gaps between the intervals.
It is common to compare intervals from linear regression models and logistic regression models.
6.5.3 Fit-for-purpose
The final group of utility metrics are called fit-for-purpose and are not discussed as often in the literature. Drechsler (2022) states how fit-for-purpose measures could be considered something in between the previous two utility metric types. In other words, fit-for-purpose metrics are not global measures, because they focus on certain features of the data, but may not be specific to an analysis that data users and stakeholders are interested in like analysis-specific utility metrics.
Drechsler (2022) highlights how global utility metrics can be too broad and miss aspects of the synthetic dataset that do not align with the confidential dataset. On the other hand, analysis-specific metrics may perform well for the selected analyses on the synthetic data but not for others. This is why it is critical to determine the proper analysis, but it is difficult to anticipate all downstream data uses. For example, decennial census data products in the United States are utilized in thousands of different ways, making it impossible to predict all potential use cases. Therefore, fit-for-purpose metrics help privacy experts and researchers assess if their synthesis makes sense before implementing other utility metrics. Some examples include ensuring population totals or ages are positive.
6.6 Assessing disclosure risk
We now pivot to evaluating the disclosure risks of public data. Note that most thresholds for acceptable disclosure risk are often determined by law.
There are generally three kinds of disclosure risk:
- Identity disclosure risk
- Attribute disclosure risk
- Inferential disclosure risk
6.6.1 Identity disclosure metrics
Identity disclosure occurs if the data intruder associates a known individual with a public data record (e.g., a record linkage attack or when a data adversary combines one or more external data sources to identify individuals in the public data).
Sweeney, Abu, and Winn (2013) used voter data to re-identify individuals in the Personal Genome Project.
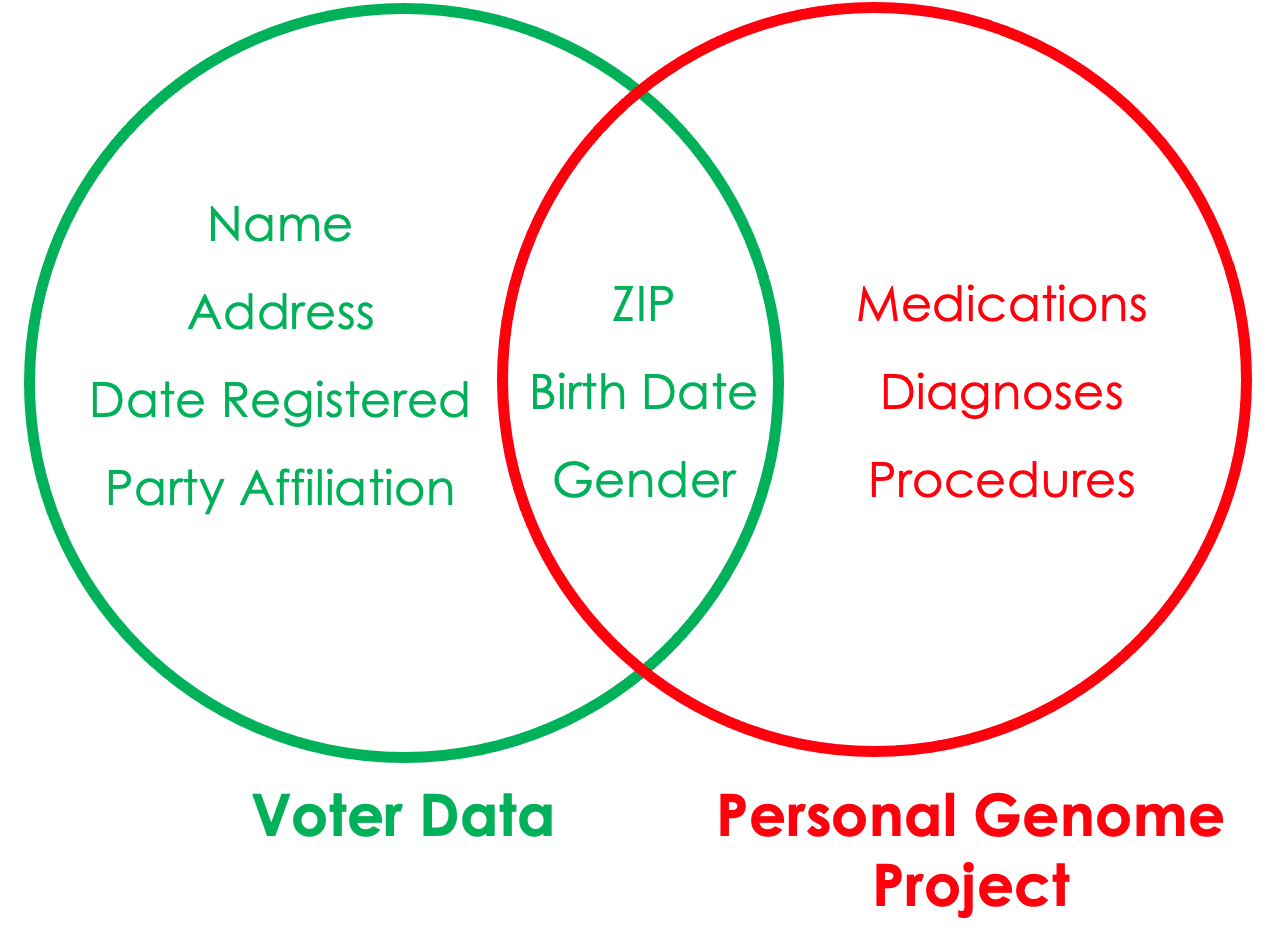
Identity disclosure metrics evaluate how often we correctly re-identify confidential records in the public data.
Note: These metrics require major assumptions about attacker information.
Basic matching approaches
We start by making assumptions about the knowledge an attacker has (i.e., external publicly accessible data they have access to).
For each confidential record, the data attacker identifies a set of public records which they believe contain the target record (i.e., potential matches) using the external variables as matching criteria.
There are distance-based and probability-based algorithms that can perform this matching. This matching process could be based on exact matches between variables or some relaxations (i.e., matching continuous variables within a certain radius of the target record, or matching adjacent categorical variables).
We then evaluate how accurate our re-identification process was using a variety of metrics.
Expected Match Rate: On average, how likely is it to find a “correct” match among all potential matches? Essentially, the expected number of observations in the confidential data expected to be correctly matched by an intruder.
Higher expected match rate = higher identification disclosure risk.
The two other risk metrics below focus on the subset of confidential records for which the intruder identifies a single match.
- True Match Rate: The proportion of true unique matches among all confidential records. Higher true match rate = higher identification disclosure risk.
- False Match Rate: The proportion of false matches among the set of unique matches. Lower false match rate = higher identification disclosure risk.
6.6.2 Attribute disclosure metrics
It is possible to learn confidential attributes without perfectly re-identifying observations in the data.
Attribute disclosure occurs if the data intruder determines new characteristics (or attributes) of an individual based on the information available through public data or statistics (e.g., if a dataset shows that all people age 50 or older in a city are on Medicaid, then the data adversary knows that any person in that city above age 50 is on Medicaid). This information is learned without idenfying a specific individual in the data!
Predictive accuracy measures how well an attacker can learn about attributes in the confidential data using the public data (and possibly external data).
Similar to above, you start by matching public records to confidential records. Alternatively, you can build a predictive model using the public data to make predictions on the confidential data.
key variables: Variables that an attacker already knows about a record and can use to match.
target variables: Variables that an attacker wishes to know more or infer about using the public data.
Pick a sensitive variable in the confidential data and use the public data to make predictions. Evaluate the accuracy of the predictions.
6.6.3 Inferential disclosure
Inferential disclosure occurs if the data intruder predicts the value of some characteristic from an individual more accurately with the public data or statistic than would otherwise have been possible (e.g., if a public homeownership dataset reports a high correlation between the purchase price of a home and family income, a data adversary could infer another person’s income based on purchase price listed on Redfin or Zillow).
Inferential disclosure is a specialized type of attribute disclosure, so the metrics discussed above apply here as well. Inference disclosure risk is very hard to predict, so many federal agencies tend to disregard this type of risk.
6.7 There are lies, damned lies, and statistics…

There are often two sides to every story, especially when it comes to how people collect, store, transfer, and analyze data. In this in-class activity, we will apply the ideas and concepts we’ve learned so far to answer a question in multiple ways that are technically correct, even if the different answers contradict one another.
Topic assignments:
| Student Last Name | Topic |
|---|---|
| Androlewicz | What percent of marriages end in divorce? |
| Boyar | What is the percentage of African American men incarcerated compared to those in college? |
| Choate | What is the carbon footprint of raising a child? |
| Clayman | What is the gender pay gap? |
| Cousins | At what age are women less likely to get pregnant? |
| Daversa | What is the average student loan debt? |
| Dowdy | What is the rate of illegal immigration? |
| Duhil de Benaze | What is the primary factor that causes homelessness? |
| Espinal-Guzman | What is the rate of sexual assault? |
| Gallishaw | At what age do mental health disorders develop in people? |
| Garratt | What is the teenage pregnancy rate? |
| Kim | At what year after being founded do most startup companies fail? |
| Morris | What percentage of immigrants are taking jobs from Americans? |
| Mueller | What is the average cost of raising a child? |
| O’Brien | What percentage of crimes are committed by someone known to the victim? |
| OKeefe | What percentage of welfare recipients are able-bodied adults who don’t work? |
| Pacheoco | What is the fraud rate of using food stamps? |
| Pushard | Does the unemployment rate accurately reflect joblessness? |
| Scott | What percentage of immigrants are undocumented? |
| Thadeio | What is the percentage of abortions performed on teenagers? |
| Thorbahn | What is the percentage of gun violence? |
| Washington | What percentage of energy consumption comes from renewable sources? |
6.8 Week 5 Assignment
Due July 27, at 11:59 PM EDT on Canvas
6.8.1 Read
- Chapter 6: What Data Privacy Laws Exist?
6.8.2 Optional additional read
6.8.3 Optional watch
6.8.4 Collect data
For one day, record how often private companies collect your data from the moment you wake up to the moment you go to bed. For example, opening a social media app or browsing the web.
6.8.5 Write (600 to 1200 words)
Based on your data log, answer the following questions:
- Is any of the information collected by private companies protected by a state or federal law?
- What could a private company do with that information for the public good?
- What could a private company do with that information that may harm or violate your personal privacy?
- What are the data equity and ethical impacts of collecting this information?
“An article written to inform readers about recent events. The author reports and attempts to deepen understanding of recent events—for example, by providing background information and other kinds of additional context.” – CSUSM Library↩︎